Sections
Proposals
Site Activity
Related
|
Main /
|
Recent Changes Printable Page History Edit Page |
EHES_20041010 Fred comments.
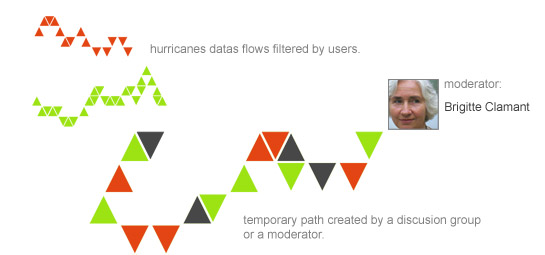
1- The hurricane like information flow.
Glyphiti is a collaborative draw where each user can draw a part of a common creation.
http://www.artcontext.net/glyphiti
Each one is drawing with his individual imaginary and iconography a contiguos o no contiguos desire a message or a simple grafic noise. This continuous flux of symbols and grafics are the stratifications of our digital culture. Finding a common sense of the total draw could be speaking about a comon visual digital culture of rich countries immersed in a deep ocean of information, a soup of stimulus.
http://ap.tbo.com/ap/breaking/index.htm
We can find various web sites offering breaking news like "TBO AP news", news like a contiunous flux of information, a big waterfall of sense and non sense, and for each of us a replete and a hole space of confusion.

On the bottom of this breaking news page we can find a link to "TBO hurricane guide".
http://hurricane.weathercenter.com
Perhaps better than comparing breaking news to a waterfall we compare it in EHES project to a hurricane because hurricanes move all around the world over rich and poor countries and over of the abstraction of frontieres. We use breaking news to create like Glyphiti a colaborative map of our world sucking information flow through the big medias hurricanes. When we use the image of hurricane in the serch of EHES visual identity after all this hurricane is in our minds and for EHES project we don't need to draw it with 3D tools because it is here every days and hours. finnaly frommy point of view it is really better to concentrate the efforts in the creation of the geodesic map than loosing energy in a 3D hurricane. The best way is to atract the user in the idea than he will be able to control a 3D hurricane through the advertisement we will develop. But the user will not find any 3D hurricane no more than this contiunous flow of datas ans some snapshots of a estate of the information hurrciane like below.
2- The geodesic map.
In EHES project users can catch informations from the flow of news we can catch online and use them to cover a geodesic map made of triangles.
Geodesic surface flattened to a map
Hauk and DirtyBomb in conversation over an interface idea for an environmentally-themed art/activism forum/project/web-site world-domination- by-the-good-guys scheme. This interface idea touches on some math (Math anyone!).
Imagine a globe that is divided in triangles, now flatten them out as a 2D map. We would like to be able to move our 'viewfinder' within this flattened map, showing a subset of the triangles at any given moment. As a practical matter when dealing with the web, things need to be loaded 'progressively', so we need to be able to create a list of triangles (an array) that are newly encountered when we 'scroll' left, right, up or down.
In a nutshell, DirtyBomb tells Stewart that if he'd develop the subroutines relating to the indexing of facets of the surface, he'd be willing to help write the 2-D navigation mechanism for a web interface. The tricky part is that the surface needs to be expandable, so it's not just a fixed problem, but rather one that needs to work where number of indexes = n. This may be something that interests you, or perhaps not. But in any case, we think the cause (environmental info) is good and if we cast about a bit, we are bound to find some people who will formalize this problem (in javascript, preferably).
http://www.artcontext.org/act/05/ehes/index.php/Main/OzoneWatcher See also...
Hauk:
it's not so convoluted the geometry problem, at least a 3d floating window of a geodesic sphere for locating a p.o.v and a pseudo 3d, orthographic 2d tile backround.
the main problem is mapping the data which is usually in a rectangular x,y grid - formally a cylindrical projection akin to mercator - geodesic mappings are equal area projections so the mapping of datum to iconography in a tile frame requires a variable l.o.d so as not favor the poles with finer detail. (most data sets in earth/space science at least provide with their meta-info a preamble about the specifics of this problem as they dealt with it in their codes etc. - whether to use a reverse interpolation or variable sampling as y/-y increases as you move away from the axis of the equator at the center of the gridded map.)
http://www.macromedia.com/devnet/mx/flash/articles/3d_classes_03.html
(regarding Hauk's reference to 3D possibilities with actionscript and flash.) i'm not so convinced. i've played with some Java 3D stuff that looks more appealing to me. if i'm the one doing the coding, i'd rather do it with java. that stuff at macromedia is so half-assed. if you draw a line in 3-space, it's going to be the same width from point to point, regardless of the z dimension. it's not really a 3D toolkit. you can simulate 3D lines with polygons, but how inefficient is that? that article does demonstrate how we could produce a geodesic surface in flash, but suppose you want to superimpose something on that surface? you don't have texture mapping, so you'd have to create all the graphics with polygons.
my view is that if we are going to use flash (which, with respect to the screen saver _is_ probably the easiest option) the amount of 3D flash stuff has to be _minimized_ in order to keep us from tearing our hair out.
on the web, i think it's possible to do more creative things merging 2D-3D and geometry. with Java3D. granted, there are people who won't have it installed, but that can be dealt with in a graduated way where some people get more features than others.
fred comments_20041011
news channel geodesic distribution.
Each news catched by users can be represented through one of the three categories defined by Andy like weather news, sports news and crime reporting.
The way to distribute news on the map could be based on cellulars automatas. ( ref. lifelab. http://www.trevorrow.com/lifelab )
For exemple when one information cell is born ( from hurricane datas flow or blog) it has to be created near a same color but not near 2 same colors...and so one inspired by automatas. Now the good play could be to destroy information nodes when for exemple there is no way for a new node to be born near a single same color because all cells are occupied. Then this could generate the destruction of acontiguous cell of information from the same color to let the channel's chain growing.
The orange area is the ozone pole area defined like the place to exchange information online through chat and organize a continue datas base and forum). This area is linked to ozone datas.
fred_20041013
About trajectories and hurricanes tracking maps.
lilke we can see in hurricane.weathercenter.com web page, it si posible to follow hurricane's trajectory.
That's why if we use some laws to create new cells we can create cell's trajectories on the map. The interesting aspect is that the last cell in the trajectory is the last created and following a trajectory is following time of creation of cells.
i like this last image. (remember to add the suffix in the Name... section when uploading files.
http://www.artcontext.org/act/05/fixNews/applet/
DirtyBomb
alexxxx: http://www.artcontext.org/act/05/fixNews/pub/earthparticle.swf http://www.artcontext.org/act/05/fixNews/pub/tetra.swf http://www.artcontext.org/act/05/fixNews/pub/eicosa.swf http://www.artcontext.org/act/05/fixNews/pub/octa.swf http://www.artcontext.org/act/05/fixNews/pub/to34swf.swf
HaukEye adds this page of links and developing comments: HaukNotes
HaukEye likes these ideas of fred and offers kudos to DirtyBomb for his journey into the uglies of geodesic hairiness !
the thoughts of fred that entertains seperate channels of interest codified here as colored indices suggests a couple of thoughts about inter-relations between different channels and how, perhaps, that might be drawn into the interface as overlapping maps of gridded information, how these relations might be explored through user selection within some interface element and what kinds of graphic iconography might then be used to identify and play in an allegorical sense with these relations. for example, a water channel and a bioExtinctus channel.
HaukEye wonders further what fred has in mind in suggesting cellular automata here, the notion of being able to see the evolution of the system over time in which there is a game of life allegory at play.
The work done up this is really good and i like very much how Alex did this representation. Perhaps a interesting aspect in my comments bellow is that we should escape from the conventional view angle starting from another point of view because we are in the cosmos after all. About the aspects of drawing continents wtih single lines, i am not sure it is a good idea now but i did it then...
draw 01. The earth map on computer's earth screen savers is generally very photorealistic and focused on a same view angle defined by the central equator and generally focused between europe and north america. Why there are no representation of earth with south pole on top of the map ? We are in the cosmos then there is no reason why we should center the vision in a fixed angle. The other aspect of the modeling is that we never see the antipode country by transparency that's why it could be great to represent earth map with singles vectorial lines on a transparent sphere.
draw 02. The information modules are created on a invisible grid and the creation of each new triangle is drawing the spheric aspect of the map.
draw 03. The superposition of the information modules and the map can be independent. Like atmospheric clouds the triangles could be autonomous from the earth map because if the triangles are generated by automatas laws it is necesary to explain that information cells are moving all around earth.
draw04. In the first draw we can see that information modules could have a certain transparency to reinforce the spherical aspect but in the draw below the map could be presented in a 2D mode to be more clear in the moment to use the modules.
- >
After all the most important aspect now should be to resolve what Hauk said about creating links between contains of different channels. Perhaps this could be resolved in Andy "fractal" triangle...but perhaps too much complicated. If a triangle can contain other triangles then it can be composed by other sub-triangles from others colors which are direct links to other triangles information modules. clicking on a link should move us on another triangle over the map. If the information cells move all over earth and we want to catch them it should be necesary to tag them like sharks in ocean of know !!
vero thinks these globes are really perfects, It�s because maybe she feels them far from the Earth. If Fix News want to be an alternative info-world channel, il could show another world face, like g�o�de one (?). [g� d�io]-> tierra yo-dividido

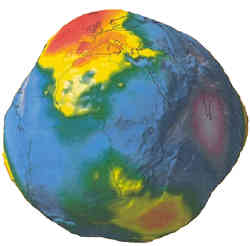
g�o�de:
http://www.ens-lyon.fr/Planet-Terre/Infosciences/Geodynamique/Structure-interne/Geoide/geoide2.html
I agree with Vero, and the link Hauk provided about the Buckminster Fuller Institute convinces me of this even more. There is a kind of idealism in the Fuller dome imagery that I do not want to follow too closely. The reason, to be blunt, is that I find many of the extensions of Fuller's architecture to be absolutely kooky. Spherical homes were never practical! Granted, it's nice that he was able to "think outside the box," but the social utopian delusion of Fullerian architecture is something with which I do not wish to associate myself.
With that in mind, I think that distortion is a prominent option. It immediately signals a more nuanced tone regarding the imagery we are dealing with. And, fortunately, I think distorted domes are easy to adapt from the original geometry.
DirtyBomb
When Hauk spoke about about inter-relations between different channels perhaps another idea should be to consider some specific hibrid paths of news like moderator's or discusion group pathes composed by various channels. Each chain growing on the map (growing through automatas laws to define the new position of a triangle in the chain) could be a single moderator construction linking a way between various news. We can combine both single channel's paths acting like the source of information and some strange paths mode of various colors composed by moderators. In a certain way the hurricanes are generating news all over the map but it is posible to create various combinations of them to create a sens developped later in the ozone hole through some invited moderators creating sens. Off course the moderators could be everybody who would like to do it but we could invite specific people. after all we could record paths of news like DNA sequencies.
FredAdam
how do other people feel about this? i have reservations. i guess it's partly because i am not attracted to the personality issues that could emerge. but it's also, i think, because at some level i would like to see the news remain topical and formal rather than chat. in other words, i've been envisioning the labor applied by volunteers as editorial and selective rather than psychosexual/id amusement. maybe i'm imagining something impossible, but it seems to me that the interface can encourage certain types of interaction and discourage others. i'm not sure the web needs another discussion as much as it needs sources of topical information and experience that are well formed (edited) and not dependent on corporate interests.
DirtyBomb
vero thinks that it�s neccessary to defend inter-relations between different channels, but she doesn�t like the moderator figure. May be we need a compilator more than a moderator (like in java), if someone want to create a path and save it he can do it but he doesn�t "moderate" the flux of news but suggest links between them. It could be attractive for some users have a guide but not a leader.
I agree, after all this idea of moderator should look like too much didactic and fall in a too formal project. But we should consider the posibility in the ozone hole to create and share links between various news. F.
I could agree with vero and fred about the need of a inter-relation between the users and the flow of information (in one channel of course).the compilator moderator of an arragment of topics is greatand if we are lucky it could be useful also. If we face a psychosexual id crisis by a moderator i believe that it could give serious consideration for e-democracy which is not bad at all, or we have to face it. From the other hand i could not understand where is the "psychosexual/id amusement" while it is very amusing. if it has to do with the fact of name, picture and id we could import the idea of unnamed (nickname etc) participation. alexxxx
When we spoke about ozonewatcher at the beginning it was important to use the screensaver to join a group and be a part of a network like a sitin group.When we spoke to send a fax to a corporation ridiculing kyoto protocol it was not necesary to send 1000 mails but a single fax with the number of users of the screensaver.
That's why if we are in front of problem of datas height and speed it could be better first of all to produce a screensaver showing this network, i mean real people. In this case we could see the south pole of the spheroide and some small points who should be the users online for exemple. We could combine it with a small stream off news in the screen like titels appearing in the screen saver ( a little bit like this project streaming google search queries : http://www.key-words.info/ )
The first view angle of the spheroide should be the south pole with people then.Here the esencial idea is to fix us on the scientific maps. Passing to user mode is loading parts of the geodesic map and moving all over the downloaded parts catching for triangles of news and following then the hurricanes trajectory. The user could have the posibility to enter in the real exchange space which is a normal web page in fix news server.
Alex previews :
http://www.artcontext.org/~transnt/terranode.org/modeling/geoEicosa10F10D.swf geoEicosa10F10D http://www.artcontext.org/~transnt/terranode.org/modeling/geoEicosa10F10DNolines.swf geoEicosa10F10DNolines http://www.artcontext.org/~transnt/terranode.org/modeling/geoEicosa10F10Dwire.swf geoEicosa10F10Dwire http://www.artcontext.org/~transnt/terranode.org/modeling/geoEicosa10F15D.swf geoEicosa10F15D http://www.artcontext.org/~transnt/terranode.org/modeling/geoEicosa10F15Dwire.swf geoEicosa10F15Dwire http://www.artcontext.org/~transnt/terranode.org/modeling/geoEicosa20F10D.swf geoEicosa20F10D http://www.artcontext.org/~transnt/terranode.org/modeling/geoEicosa20F15D.swf geoEicosa20F15D http://www.artcontext.org/~transnt/terranode.org/modeling/geoEicosa20F15DNolines.swf geoEicosa20F15DNolines